This is a bar chart with data value labels. Data value labels can be used as an alternative to (or along with) Y tick labels, but only with bar and stackedbar charts. (Bar chart data value labels were added to PHPlot-5.0rc3.)
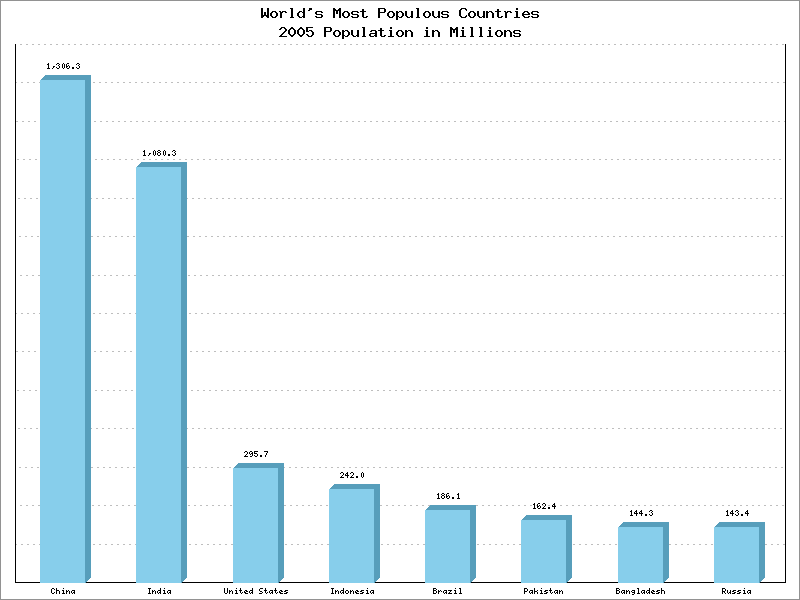
Example 5.19. Bar Chart with Data Value Labels
<?php
# PHPlot Example: Bar chart, with data labels
require_once 'phplot.php';

$data = array(
  array('China', 1306.31),           array('India', 1080.26),
  array('United States',  295.73),   array('Indonesia', 241.97),
  array('Brazil', 186.11),           array('Pakistan', 162.42),
  array('Bangladesh', 144.32),       array('Russia', 143.42),
);

$plot = new PHPlot(800, 600);
$plot->SetImageBorderType('plain');
$plot->SetPlotType('bars');
$plot->SetDataType('text-data');
$plot->SetDataValues($data);
$plot->SetTitle("World's Most Populous Countries\n2005 Population in Millions");

# Turn off X tick labels and ticks because they don't apply here:
$plot->SetXTickLabelPos('none');
$plot->SetXTickPos('none');

# Make sure Y=0 is displayed:
$plot->SetPlotAreaWorld(NULL, 0);
# Y Tick marks are off, but Y Tick Increment also controls the Y grid lines:
$plot->SetYTickIncrement(100);

# Turn on Y data labels:
$plot->SetYDataLabelPos('plotin');

# With Y data labels, we don't need Y ticks or their labels, so turn them off.
$plot->SetYTickLabelPos('none');
$plot->SetYTickPos('none');

# Format the Y Data Labels as numbers with 1 decimal place.
# Note that this automatically calls SetYLabelType('data').
$plot->SetPrecisionY(1);

$plot->DrawGraph();