This example shows the standard legend appearance, followed by the same plot with point shape markers in the legend instead of color boxes, and again using a line plot with line markers. Using point shapes in the legend was added in PHPlot-5.4.0. These are useful if you need to be able to interpret the legend without color, for example with monochrome printing, or for accessibility reasons. Using line markers in the legend was added in PHPlot-6.0.0. When used with varying line widths, this can reduce the dependency on color to identify the plotted lines. See Section 3.7.2, “Legend” for more on the plot legend.
Example 5.35. Legend with Color Boxes or Shape Markers
First, here is the standard legend with color boxes.

<?php
# PHPlot Example: Linepoints plot with legend using color boxes or shape markers
require_once 'phplot.php';

# The variable $use_shapes can be set to TRUE in another
# script which calls this script, to use shape markers
# rather than color boxes in the legend.
if (empty($use_shapes)) $use_shapes = FALSE;
# The variable $plot_type can be set in another script as well.
if (empty($plot_type)) $plot_type = 'linepoints';

# Use data labels to display only the points we want,
# but specify the same values for X to get the correct
# spacing.
$data = array(
  array('1990', 1990, 41308, 21015, 62634),
  array('1995', 1995, 44310, 13883, 61529),
  array('2000', 2000, 46772,  9000, 59421),
  array('2004', 2004, 46887,  7738, 57754),
  array('2006', 2006, 45441,  6888, 53179),
  array('2008', 2008, 42757,  5840, 49115),
);
$legend_text = array('Morning Papers', 'Evening Papers', 'Sunday Papers');

$plot = new PHPlot(800, 600);
$plot->SetImageBorderType('plain'); // Improves presentation in the manual
$plot->SetTitle("US Daily Newspaper Circulation\n"
             .  $plot_type . ' plot with SetLegendUseShapes('
             . ($use_shapes ? 'True' : 'False') .  ')');
$plot->SetPlotType($plot_type);
$plot->SetDataType('data-data');
$plot->SetDataValues($data);
$plot->SetPlotAreaWorld(1988, 0, 2010, 80000);
$plot->SetYTickIncrement(10000);
$plot->SetLegend($legend_text);
$plot->SetXTickPos('none');
$plot->SetDrawXDataLabelLines(True);
$plot->SetLegendUseShapes($use_shapes); // Use color boxes or shapes
$plot->SetPointSizes(12); // Make points bigger for visibility
$plot->SetLineStyles('solid'); // Make all lines solid
$plot->SetLineWidths(2); // Make all lines thicker

$plot->DrawGraph();
Changing the call to SetLegendUseShapes results in a legend using point shapes instead of color boxes. (This requires PHPlot-5.4.0 or later.)

<?php
# PHPlot Example: Linepoints plot with legend using shape markers
# This sets a variable and calls the script directly above.
$use_shapes = TRUE;
require_once 'legendshape.php';
With a line plot, the shape markers are line segments rather than point markers. (This requires PHPlot-6.0.0 or later.)
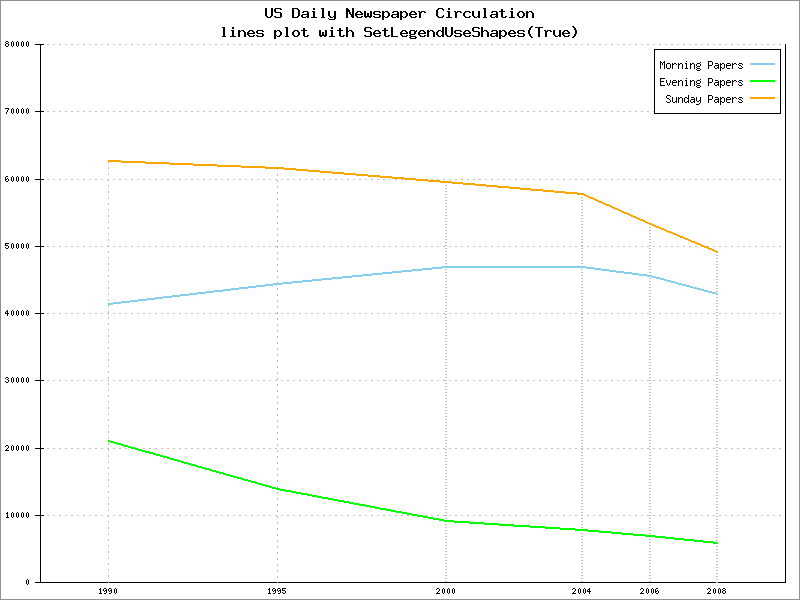
<?php
# PHPlot Example: Line plot with legend using line markers
# This sets variables and calls the script directly above.
$use_shapes = TRUE;
$plot_type = 'lines';
require_once 'legendshape.php';