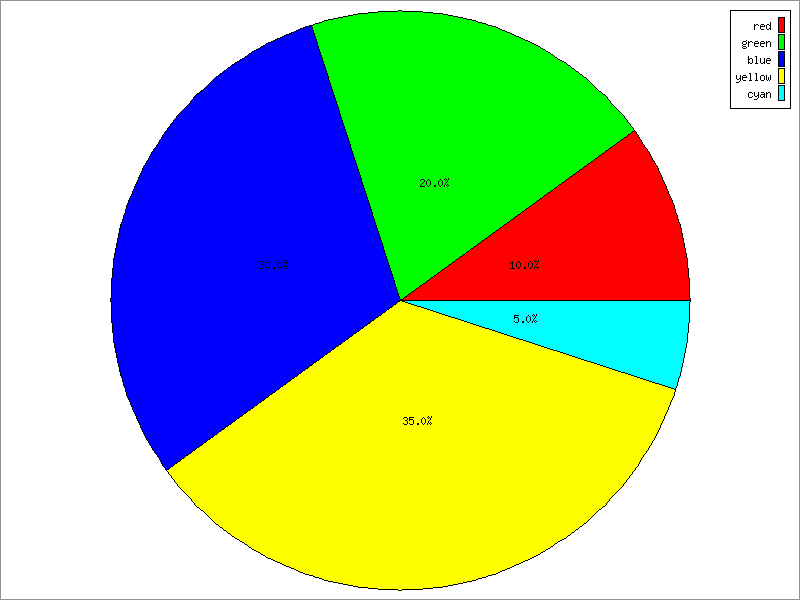
For this pie chart, we turned off shading with SetShading to get a flat pie instead of a 3-D look. We also overrode the default colors with our own array using SetDataColors, and used the same color names to make a legend with SetLegend. Finally, we moved the labels in towards the center with SetLabelScalePosition.
Example 5.10. Pie Chart, flat with options
<?php
# PHPlot Example:  Flat Pie with options
require_once 'phplot.php';

$data = array(
  array('', 10),
  array('', 20),
  array('', 30),
  array('', 35),
  array('',  5),
);

$plot = new PHPlot(800,600);
$plot->SetImageBorderType('plain');
$plot->SetDataType('text-data-single');
$plot->SetDataValues($data);
$plot->SetPlotType('pie');

$colors = array('red', 'green', 'blue', 'yellow', 'cyan');
$plot->SetDataColors($colors);
$plot->SetLegend($colors);
$plot->SetShading(0);
$plot->SetLabelScalePosition(0.2);

$plot->DrawGraph();