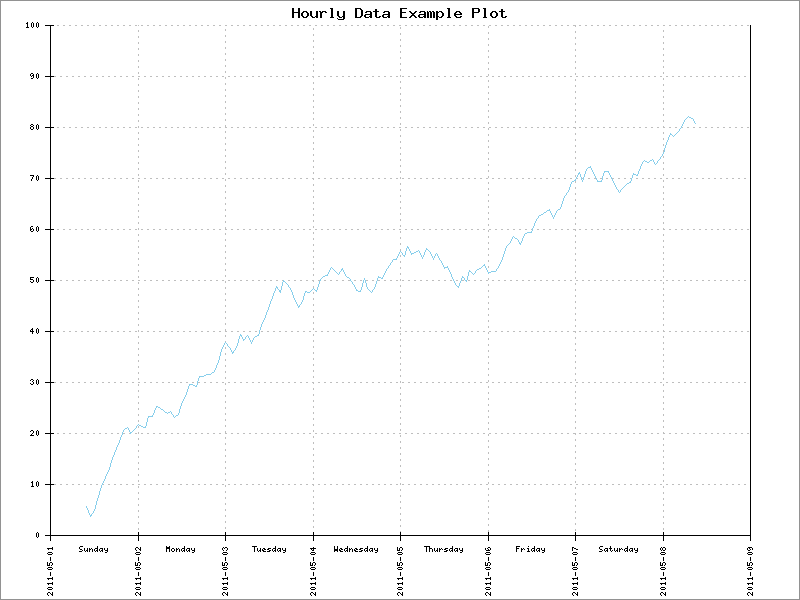
This example uses an X tick anchor (see SetXTickAnchor) to offset the X tick marks and grid lines. Hourly data is being plotted, for one week, and the goal is to have the tick marks and grid lines separate the days of the week, regardless of the time during the day of the initial data point.
In this example, both X axis data labels and X tick labels are turned on. The data labels display weekday names, and the tick labels display the dates. Having both labels on is usually something to avoid, because the labels will overlay. In this case, however, only 1 in 24 points has a data label (those points representing noon). Tick marks are also every 24 hours, but anchored at midnight. So the tick and data labels are separated. To avoid any overlap, the tick labels are drawn vertically (90 degrees) while the data labels are horizontal.
(Note that SetXLabelAngle sets the angle for both tick and data labels, while SetXDataLabelAngle sets the angle for data labels only. PHPlot does this to maintain compatibility. As a result, since the example here wants to turn the tick labels only (from the default 0 degrees), we also need to turn the data labels back to 0. The order of the calls does not matter, however. The same is true for label formatting with SetXLabelType and SetXDataLabelType. To get non-default tick label formatting and default data label formatting requires two calls as shown in the example.)
Example 5.38. Hourly Data Using X Tick Anchor

<?php
# PHPlot Example: Using an X tick anchor to control grid lines
# This example is based on a question on the PHPlot forum on 5/8/2011.
# It requires PHPlot >= 5.4.0
require_once 'phplot.php';

# The first data point was recorded at this date/time: (always top of an hour)
# Example: 5/1/2011 at 10:00am
$year = 2011;
$month = 5;
$day = 1;
$hour = 10;

# Number of hourly data points, e.g. 168 for 1 week's worth:
$n_points = 168;
# ==================================================================

# Timestamp for the first data point:
$time0 = mktime($hour, 0, 0, $month, $day, $year); // H M S m d y

mt_srand(1); // For repeatable, identical results

# Build the PHPlot data array from the base data, and base timestamp.
$data = array();
$ts = $time0;
$tick_anchor = NULL;
$d = 5; // Data value
for ($i = 0; $i < $n_points; $i++) {

    # Decode this point's timestamp as hour 0-23:
    $hour = date('G', $ts);

    # Label noon data points with the weekday name, all others unlabelled.
    $label = ($hour == 12) ? strftime('%A', $ts) : '';

    # Remember the first midnight datapoint seen for use as X tick anchor:
    if (!isset($tick_anchor) && $hour == 0)
        $tick_anchor = $ts;

    # Make a random data point, and add a row to the data array:
    $d += mt_rand(-200, 250) / 100;
    $data[] = array($label, $ts, $d);

    # Step to next hour:
    $ts += 3600;
}

$plot = new PHPlot(800, 600);
$plot->SetImageBorderType('plain'); // For presentation in the manual
$plot->SetTitle('Hourly Data Example Plot');
$plot->SetDataType('data-data');
$plot->SetDataValues($data);
$plot->SetPlotType('lines');

# Make the X tick marks (and therefore X grid lines) 24 hours apart:
$plot->SetXTickIncrement(60 * 60 * 24);
$plot->SetDrawXGrid(True);

# Anchor the X tick marks at midnight. This makes the X grid lines act as
# separators between days of the week, regardless of the starting hour.
# (Except this messes up around daylight saving time changes.)
$plot->SetXTickAnchor($tick_anchor);

# We want both X axis data labels and X tick labels displayed. They will
# be positioned in a way that prevents them from overwriting.
$plot->SetXDataLabelPos('plotdown');
$plot->SetXTickLabelPos('plotdown');

# Increase the left and right margins to leave room for weekday labels.
$plot->SetMarginsPixels(50, 50);

# Tick labels will be formatted as date/times, showing the date:
$plot->SetXLabelType('time', '%Y-%m-%d');
# ... but then we must reset the data label formatting to no formatting.
$plot->SetXDataLabelType('');

# Show tick labels (with dates) at 90 degrees, to fit between the data labels.
$plot->SetXLabelAngle(90);
# ... but then we must reset the data labels to 0 degrees.
$plot->SetXDataLabelAngle(0);

# Force the Y range to 0:100.
$plot->SetPlotAreaWorld(NULL, 0, NULL, 100);

# Now draw the graph:
$plot->DrawGraph();